The first sign was not a number. It was a color.
During a field visit to a seaweed farm off Chidiyatapu, South Andaman, we saw patches on Gracilaria edulis that were paler than the rest of the thallus. Some branches looked washed out; others had whitish tips. The change was easy to miss at a glance and impossible to interpret from a single photograph.
This is the gap VYASN is trying to understand. A farmer can see that something has changed. What is harder to see is the sequence of water conditions that came before it — the warm nights, the sudden shift in conductivity, the pH drift, the hours when nobody was on the water.
What this article is: a field report, a description of the buoy's sensor suite, and an exploration of a 28-day daily summary.
What it is not: a laboratory diagnosis, a validated disease prediction, or a claim that VYASN can detect ice-ice before visible symptoms appear.
The farm is not a laboratory
Seaweed farms are working landscapes. Lines are moved, harvested, cleaned, and repaired. Tide, wind, rain, runoff, and boat traffic all change the water around them. A single reading taken at the surface is a snapshot of one place at one moment. It cannot explain a week of exposure.
The farm we visited is no different. The lines sit in shallow, moving water, and the crop is handled regularly. That makes the farm a useful place to observe real conditions, but a difficult place to run a controlled experiment. We did not manipulate the lines, and we did not assign treatments. We looked, photographed, and recorded what the farm looked like on the day of the visit.
That distinction matters. A field photograph can show that tissue was pale. It cannot, by itself, tell you whether the cause was heat, light, salinity, disease, handling, or a combination of stressors.
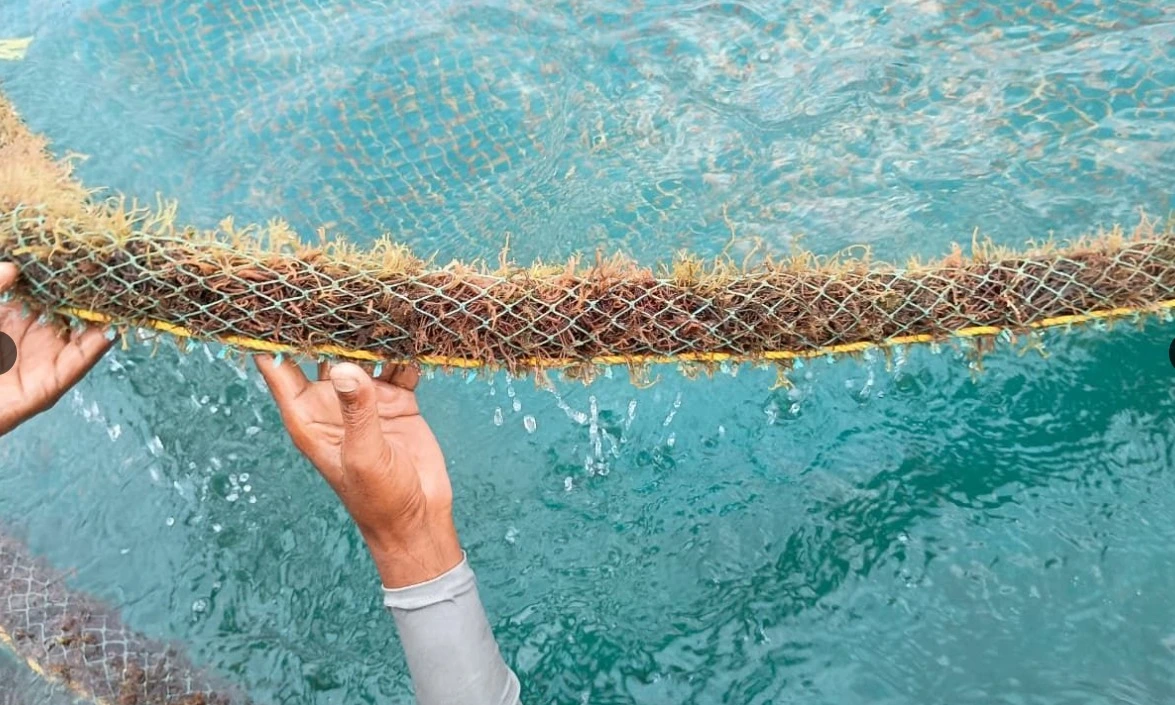
What a visit can and cannot show
The visit gave us a direct view of the crop, the lines, and the way the farm is worked. It also showed us the limits of that view. By the time we reached the farm, the water had already been changing for hours.
A monitoring buoy is useful precisely because it stays. It can record the conditions between visits, when nobody is there to see the water change.
Getting there
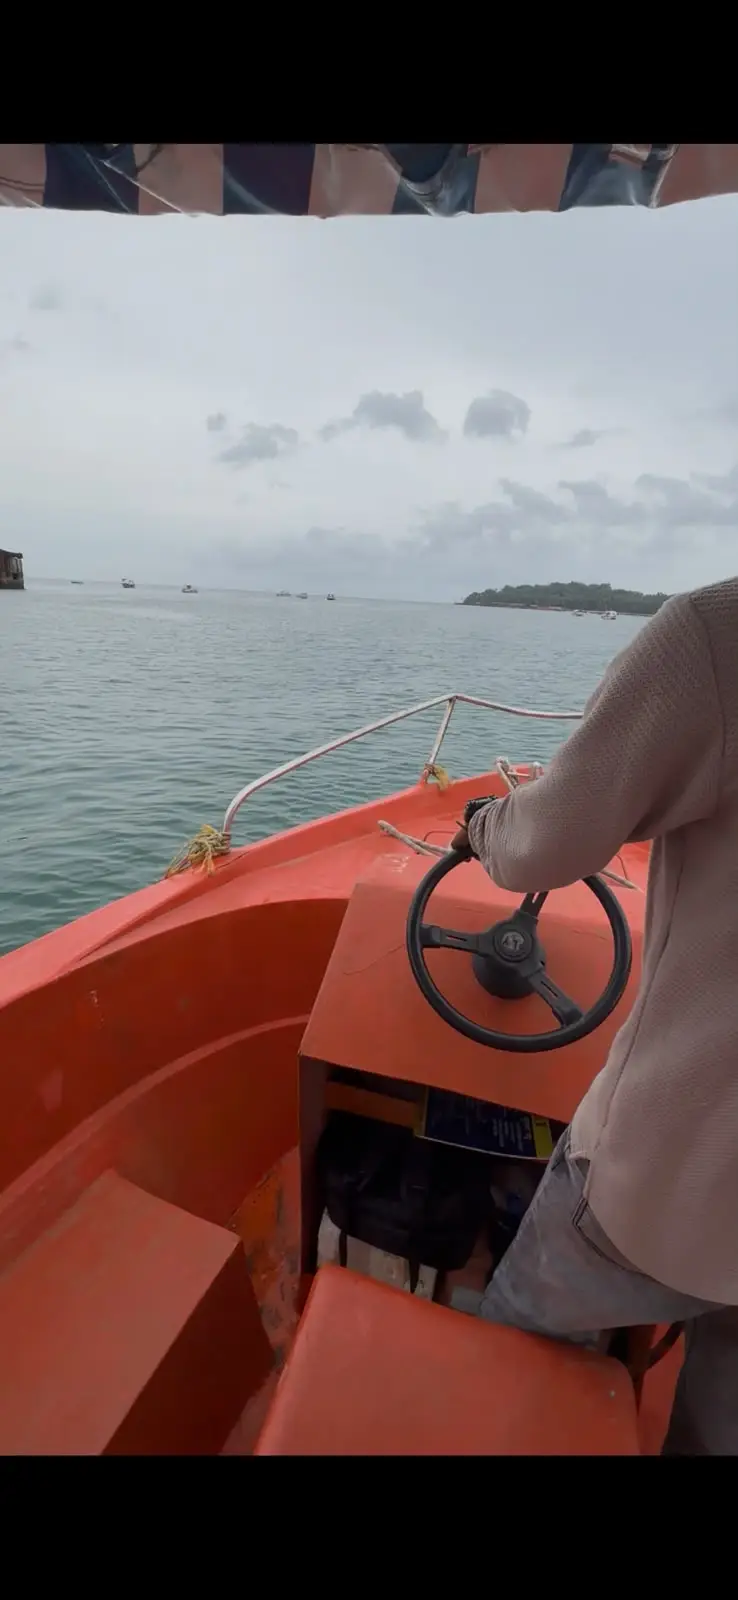
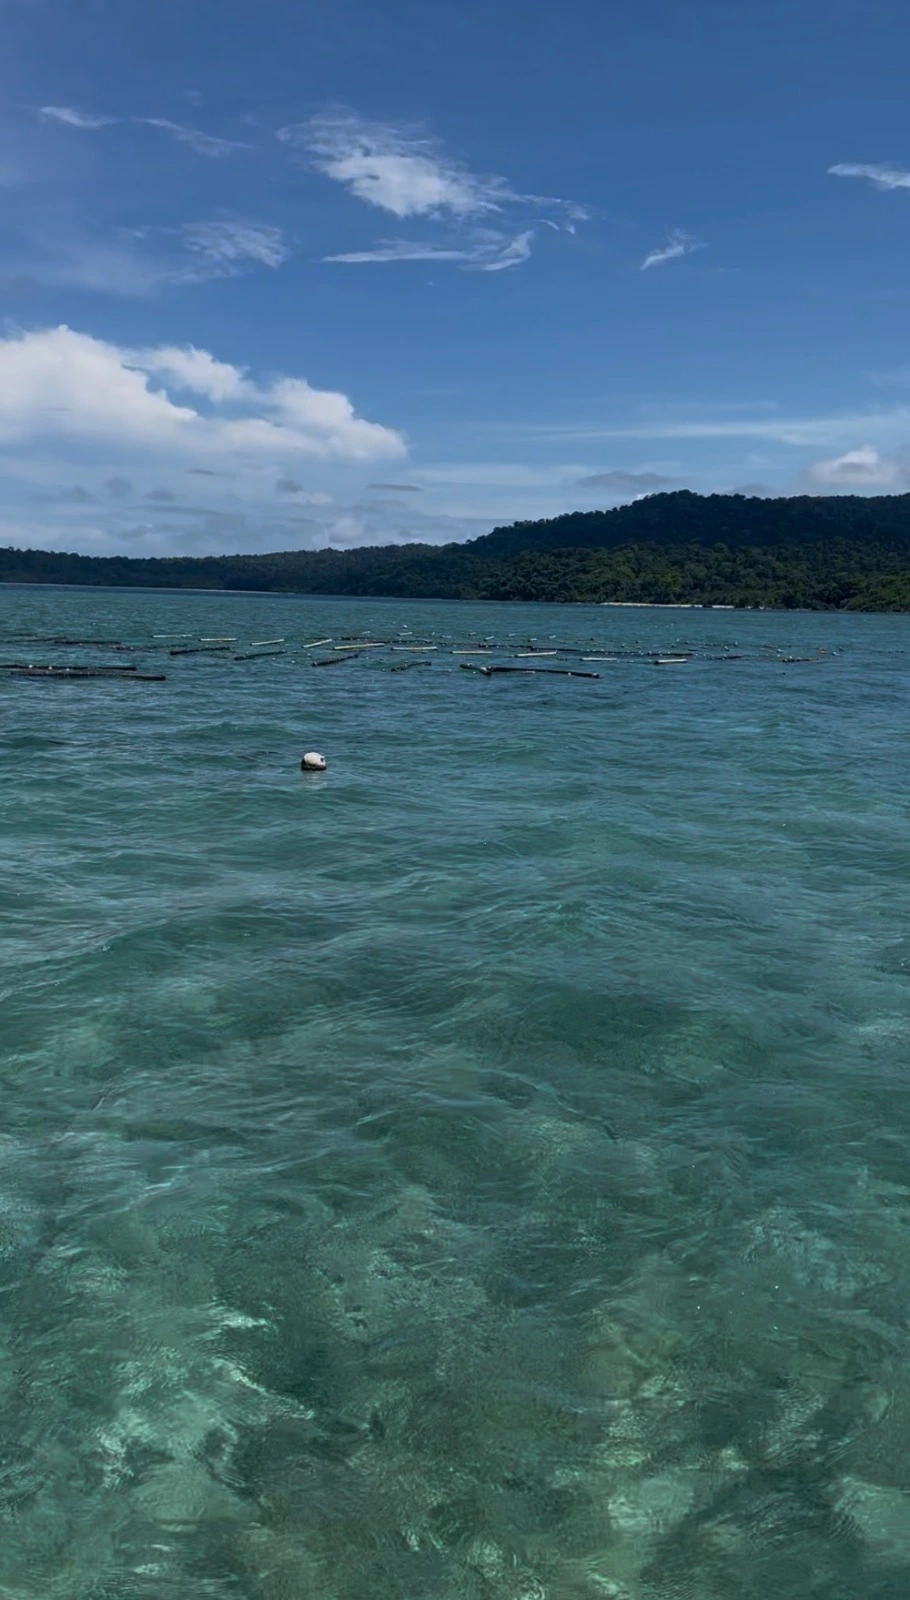
The farm is reached by small boat. The trip is short, but it changes the scale of the work: the farm is not a laboratory bench. It is a set of lines in open water, exposed to weather and tide.
The approach also makes the monitoring problem concrete. A farmer can visit once or twice a day. The ocean does not keep the same schedule. A buoy that stays with the farm can record what happened between those visits. It cannot replace the farmer's eye, but it can provide the context that a single visit misses.
The buoy
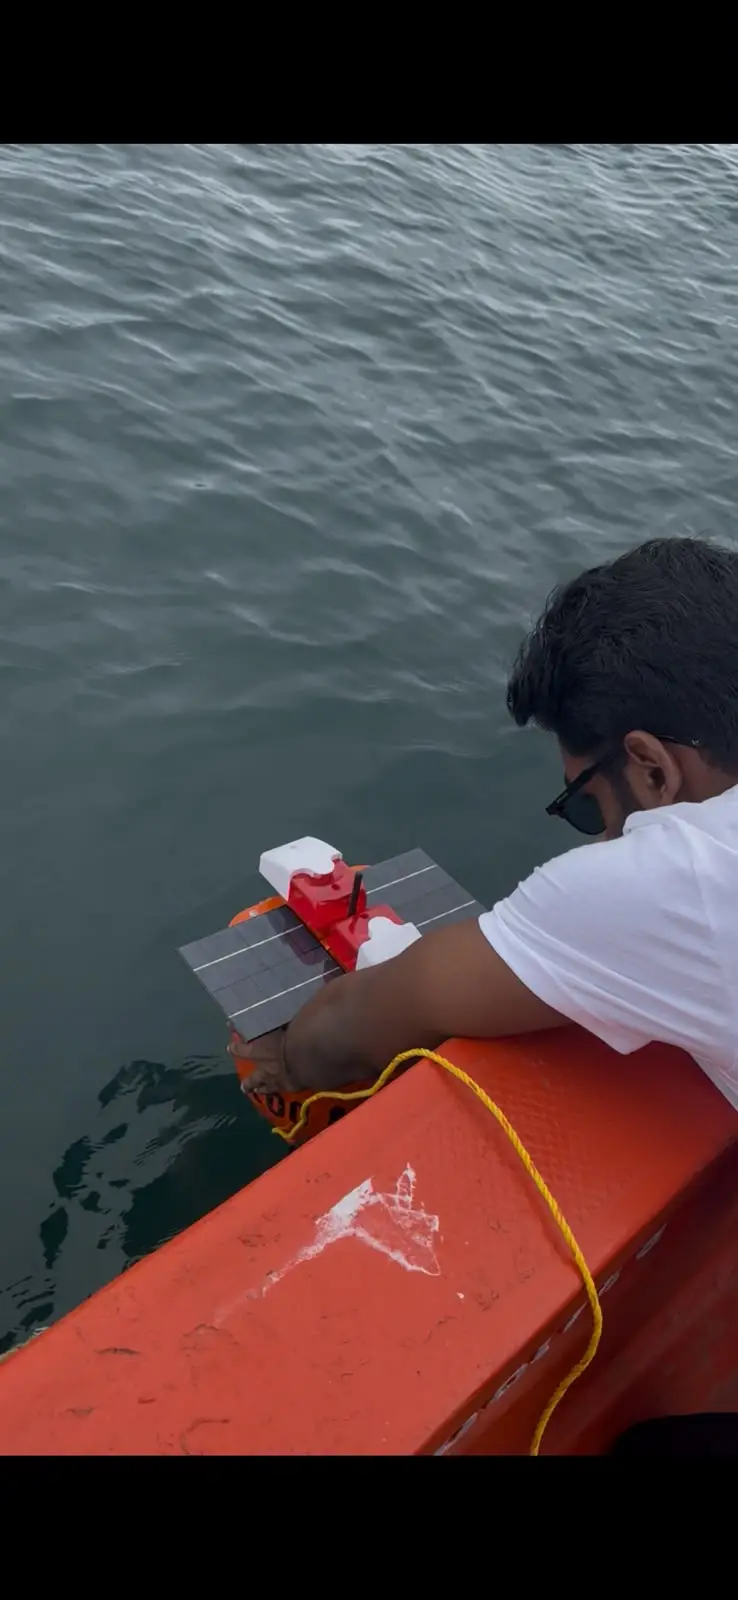
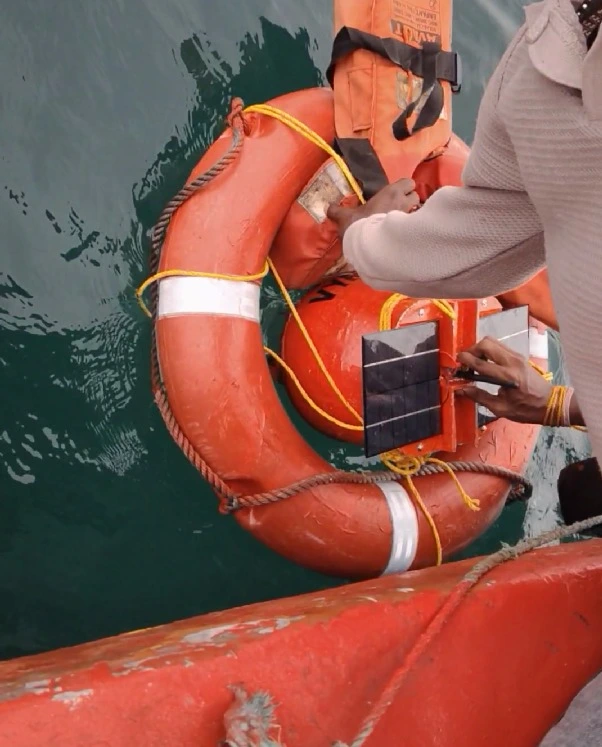
The buoy is the part of VYASN that stays behind. The field team positioned it beside the boat and lowered it into the water. The images below document that handling sequence. They do not, by themselves, confirm that every sensor was calibrated or that data transmission was successful.
The buoy's sensor suite is designed to record the conditions that matter most for a seaweed farm: water temperature, pH, electrical conductivity (EC), total dissolved solids (TDS), pressure/depth, and its own voltage and battery level.
- Temperature affects metabolic rates and stress. Sustained heat is one of the conditions associated with ice-ice outbreaks, but temperature alone does not determine whether disease will appear.
- pH influences enzyme function and the chemistry of the water. A shift can reflect runoff, biological activity, or other processes; its meaning depends on the normal range and how long it lasts.
- EC is a proxy for the water's ability to carry an electrical current, which is influenced by dissolved salts. A sudden drop can indicate dilution from rain or runoff; a sudden rise can indicate evaporation or a change in water mass.
- TDS is a related measure of dissolved solids. In the supplied summary, it is recorded in parts per thousand (ppt), not parts per million. A value of 35.3 ppt is approximately 35,300 ppm.
- Pressure/depth helps place the other readings in context: how deep the sensor is, how the tide is moving, and whether the line is sitting where the farmer expects.
- Voltage and battery are operational signals. They do not describe seaweed health, but they determine whether the monitoring can continue.
The daily summary used later in this article does not include pressure/depth. The buoy's intended sensor suite includes it.
What the images show
The photographs below show a visual sequence, from a small pale patch to more extensive whitening across the thallus. The order is based on what we observed in the field, not on a controlled time series. We did not assign a severity score, and we did not confirm a pathogen in a laboratory.
Ice-ice is a descriptive term for pale, bleached, or whitening seaweed tissue. It is associated with stress and opportunistic organisms, and it can appear when several conditions line up. That complexity is exactly why a single sensor reading is not a diagnosis. The useful question is not “is this ice-ice?” but “what was the water doing in the days before the tissue changed?”
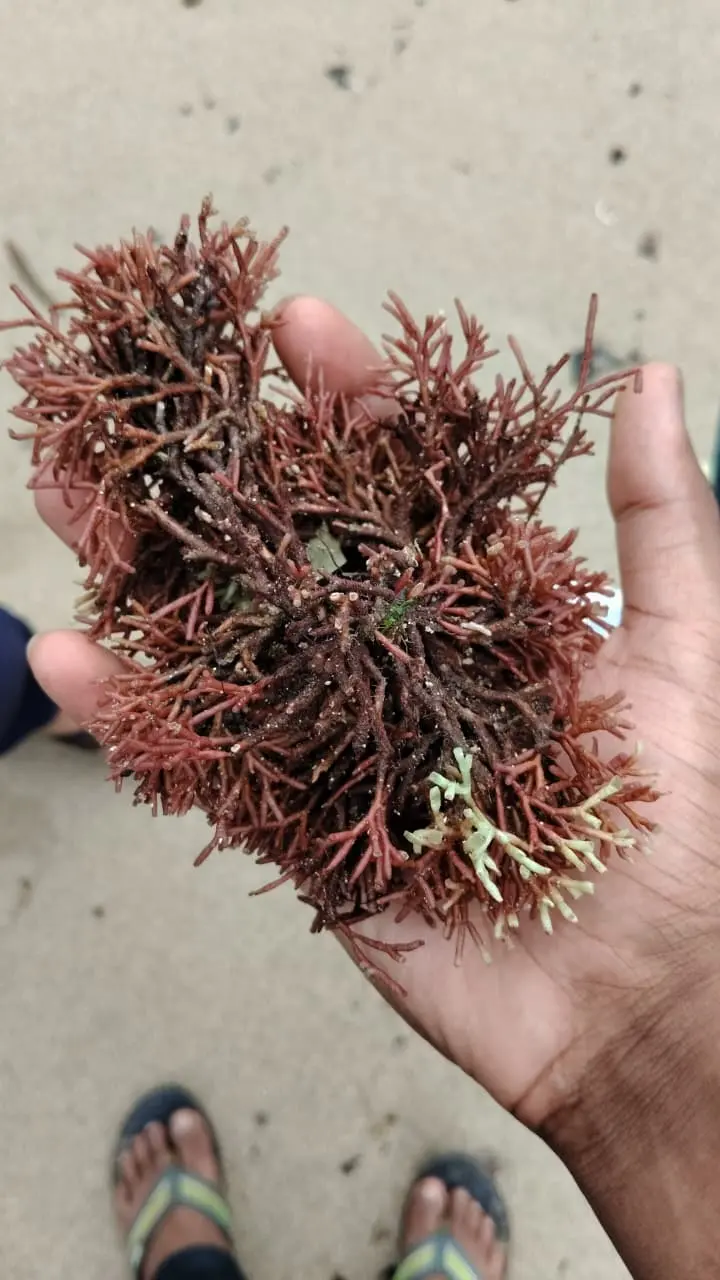
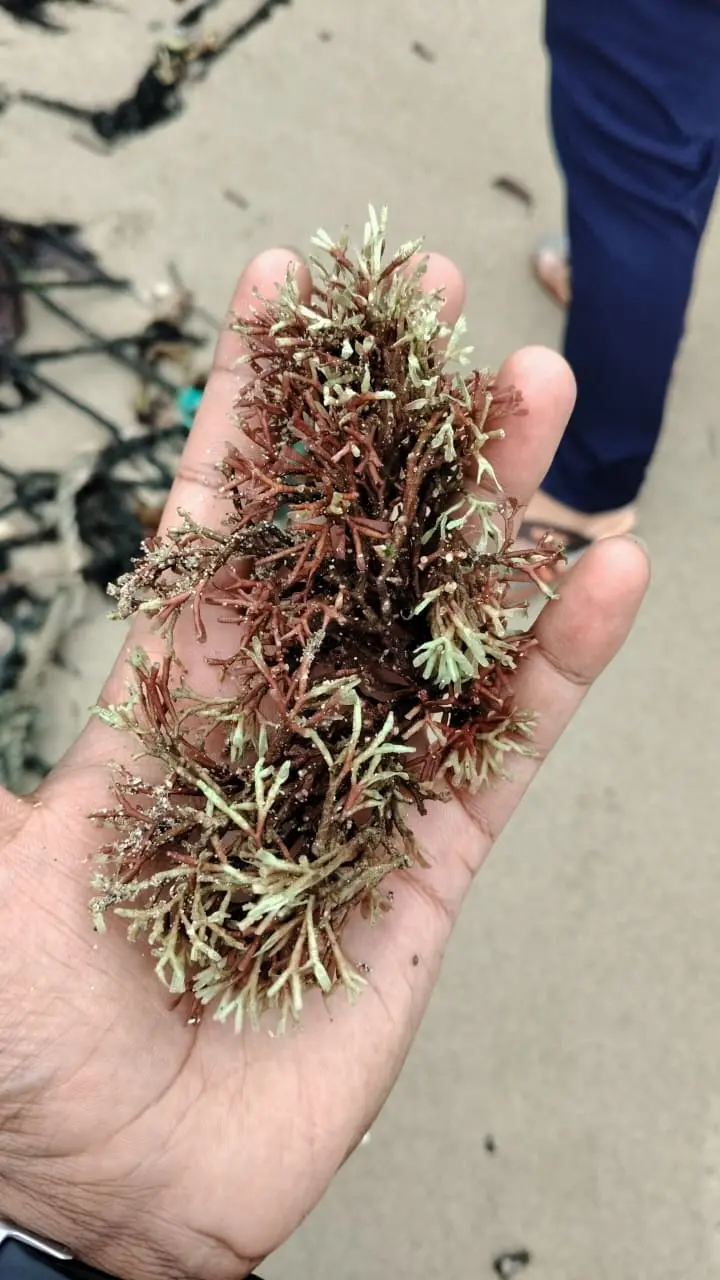
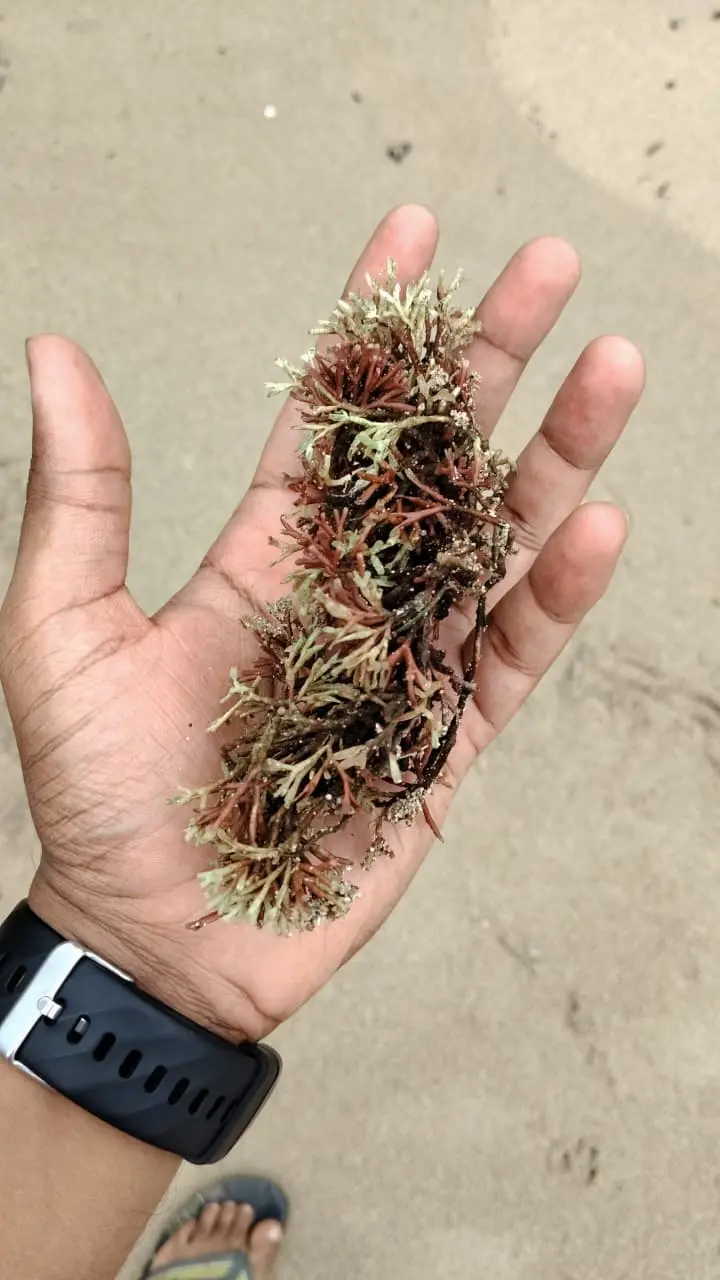
These are field observations, not laboratory-confirmed diagnoses.
The photographs are a record of what we saw, not proof of why it happened.
The 28-day record
To explore how the buoy's data could be read, we used a daily summary covering 28 days, from 18 September to 15 October 2026. The file contains one row per day, with mean, minimum, and maximum values for temperature and pH, plus mean EC, TDS, voltage, and battery level.
The summary marks Day 16 as the onset marker. We use that marker as an editorial anchor, not as a diagnosis date. The charts below show daily means; the full table includes all 28 rows. The downloadable CSV contains every column in the supplied file.
The Day 16 transition
| Day | Date | Temp (°C) | pH | EC (mS/cm) | TDS (ppt) |
|---|---|---|---|---|---|
| 15 | 28.01 | 8.093 | 52.72 | 35.33 | |
| 16 | 29.78 | 8.071 | 54.68 | 36.62 | |
| 17 | 29.86 | 8.052 | 46.52 | 31.17 | |
| 18 | 29.85 | 7.987 | 50.39 | 33.79 | |
| 19 | 29.85 | 7.983 | 53.22 | 35.68 | |
| 20 | 28.11 | 7.930 | 52.12 | 35.20 |
Temperature
Mean temperature jumps from 28.01°C on Day 15 to 29.78°C on Day 16, then stays above 29.5°C for four consecutive days. It returns to 28.11°C on Day 20. The project's current rule-based advisory treats sustained temperatures above 29.5°C as a prompt to inspect the crop. It is not a validated predictor, and this article does not present it as one.
pH
pH moves within a narrow band for most of the record. The lowest daily mean is 7.93 on Day 20, after the heat window. The summary does not establish why the pH moved, and a daily mean can hide shorter swings between readings.
EC and TDS
EC and TDS move closely together in this summary. The largest drop occurs on Day 17, one day after the temperature step. EC falls to 46.52 mS/cm, just above the project's current 46.0 mS/cm osmotic-shock threshold. That is a notable shift, not an osmotic-shock diagnosis.
Source: vyasn_daily_ice_ice_scenario_summary.csv. Chart values are generated from the daily means in that file.
The full daily summary
The table below contains all 28 rows. The download includes voltage and the full minimum and maximum columns from the supplied CSV.
View all 28 days of the daily summary
| Day | Date | Temp mean (°C) | Temp range (°C) | pH mean | pH range | EC (mS/cm) | TDS (ppt) | Battery (%) |
|---|---|---|---|---|---|---|---|---|
| 1 | 28.04 | 27.0–28.8 | 8.076 | 7.91–8.26 | 52.07 | 34.86 | 96 | |
| 2 | 28.06 | 27.0–28.8 | 8.081 | 7.91–8.27 | 52.12 | 34.93 | 94 | |
| 3 | 28.14 | 27.1–29.1 | 8.080 | 7.91–8.27 | 52.23 | 35.02 | 92 | |
| 4 | 28.15 | 27.3–29.0 | 8.080 | 7.91–8.26 | 52.35 | 35.08 | 89 | |
| 5 | 28.13 | 27.3–29.1 | 8.086 | 7.91–8.27 | 52.43 | 35.10 | 87 | |
| 6 | 28.07 | 27.2–28.9 | 8.097 | 7.95–8.25 | 52.37 | 35.07 | 85 | |
| 7 | 28.04 | 27.2–29.0 | 8.092 | 7.96–8.23 | 52.39 | 35.12 | 82 | |
| 8 | 28.02 | 27.2–29.0 | 8.100 | 7.96–8.24 | 52.44 | 35.11 | 80 | |
| 9 | 27.86 | 26.9–28.9 | 8.075 | 7.93–8.21 | 52.29 | 35.04 | 78 | |
| 10 | 27.87 | 27.1–28.7 | 8.073 | 7.94–8.20 | 52.34 | 35.05 | 75 | |
| 11 | 27.84 | 26.8–28.6 | 8.088 | 7.94–8.21 | 52.33 | 35.05 | 73 | |
| 12 | 27.85 | 26.9–28.8 | 8.086 | 7.96–8.20 | 52.41 | 35.12 | 71 | |
| 13 | 27.89 | 27.1–28.8 | 8.078 | 7.96–8.21 | 52.58 | 35.20 | 68 | |
| 14 | 27.97 | 26.9–28.7 | 8.078 | 7.95–8.21 | 52.69 | 35.28 | 66 | |
| 15 | 28.01 | 27.1–28.9 | 8.093 | 7.86–8.21 | 52.72 | 35.33 | 63 | |
| 16 | 29.78 | 29.0–31.0 | 8.071 | 7.91–8.20 | 54.68 | 36.62 | 61 | |
| 17 | 29.86 | 28.9–30.7 | 8.052 | 7.78–8.20 | 46.52 | 31.17 | 59 | |
| 18 | 29.85 | 29.1–30.7 | 7.987 | 7.93–8.18 | 50.39 | 33.79 | 57 | |
| 19 | 29.85 | 28.8–30.8 | 7.983 | 7.94–8.03 | 53.22 | 35.68 | 54 | |
| 20 | 28.11 | 27.1–29.0 | 7.930 | 7.89–7.97 | 52.12 | 35.20 | 52 | |
| 21 | 28.04 | 27.2–29.0 | 8.068 | 7.97–8.19 | 52.50 | 35.46 | 50 | |
| 22 | 28.01 | 27.2–28.7 | 8.076 | 7.95–8.17 | 52.67 | 35.59 | 42 | |
| 23 | 27.87 | 27.0–28.7 | 8.067 | 7.97–8.16 | 52.57 | 35.52 | 45 | |
| 24 | 27.91 | 27.0–28.6 | 8.075 | 7.96–8.17 | 52.73 | 35.62 | 42 | |
| 25 | 27.83 | 26.9–28.7 | 8.063 | 7.95–8.17 | 52.65 | 35.56 | 40 | |
| 26 | 27.86 | 27.0–28.7 | 8.071 | 7.96–8.17 | 52.72 | 35.60 | 38 | |
| 27 | 27.88 | 27.0–28.7 | 8.081 | 7.97–8.18 | 52.78 | 35.66 | 35 | |
| 28 | 27.96 | 27.1–28.8 | 8.087 | 7.98–8.21 | 52.96 | 35.76 | 33 |
The downloadable CSV includes the original voltage and full minimum/maximum columns.
What the data suggests
- Day 16 is a clear step in the daily mean temperature, not a gradual drift. The record stays above 29.5°C for four consecutive days (Day 16–19).
- The largest EC and TDS drop occurs on Day 17, one day after the temperature step. EC remains just above the project's current 46.0 mS/cm osmotic-shock threshold.
- The lowest daily mean pH in the summary is 7.93 on Day 20, after the heat window.
- The buoy's battery declines from 96% to 33% over the 28 days. That is an operational reminder: continuous monitoring depends on power management.
Looking ahead
The next step is not to make the buoy sound more certain than it is. It is to pair continuous environmental data with repeated, structured field observations: species, line depth, visible severity, handling, harvest status, and — where possible — laboratory confirmation.
That combination is what could eventually make a monitoring system useful: not a machine that declares disease, but a system that helps a farmer decide where to look, and when. The buoy can provide context. The farmer provides judgment. The field record provides the evidence that connects them.
For now, the honest conclusion is smaller and more useful: the farm changed, the water is dynamic, and a single visit is not enough to explain either. Continuous monitoring is how we start to close that gap.